At this post we will see how we can Visualise our Azure environment using the Resource Graph Explorer. Resource Graph Explorer allows you to run Resource Graph queries, create charts and pin them to the Azure Dashboard.
Resource Graph Explorer is part of Azure Governance. You can find more guides about Azure Governance at my posts like How to limit the Azure VM Sizes and How to enforce tags for resources creation using the Azure Governance tag.
Create a chart showing the number of VMs by Operating System at my tenant.
Open the Azure Portal and search for the Resource Graph Explorer and open it

The window that will open looks familiar because it uses the same query language like Log Analytics, the Kusto. On the right side, at the Resource Window, you can search for any resource type, click it and it will be added to the Query Window. We will start with the “resources” that will bring us all resources

Then we will search for virtual machines to find the correct type

clicking the microsoft.computer/virtualmachines it will automatically change the query to narrow the search to bring only the Virtual Machines

To see the results just press “Run Query”. At the Resources window you can see all the VMs properties, like name, location, tags, resourcegroup and a property named “properties”. If you open this you will see all the details of the VMs.

The Operating System property is under “storageProfile” / “osDisk” / osType. So we need to alter our query like this:
resources
 | where type == "microsoft.compute/virtualmachines"
 | summarize count() by tostring(properties.storageProfile.osDisk.osType)
Running the above query will bring the VMs by OS. Next Results you can click Charts to select the Chart you like.

You can save the query to add a name and also reuse it. The name will appear once we add the chart to the Azure Dashboard, it will be the title.

For our Dashboard I will use a Donut chart. To add it to the Azure Dashboard click “Pin to dashboard”

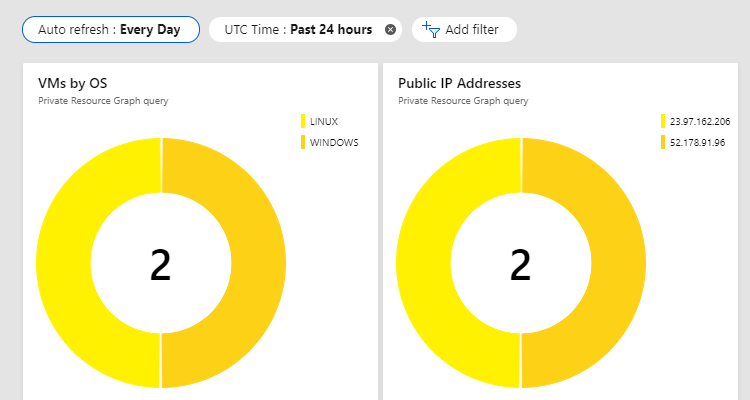
And this is the dashboard view

We can add more resources, like Public IP Addresses
Change the query to this:
Resources
 | where type == "microsoft.network/publicipaddresses"
Run it and you will get a result with all Public IP Addresses

To expand the properties, add the ” | project properties ” at the query and click the “see details” link.

View the properties details and find the name of the ip address key

To create a chart with all Public IP Addresses run the below query
Resources
| where type == "microsoft.network/publicipaddresses"
| summarize count() by tostring(properties.ipAddress)
And this is the result, pined to Azure Dashboard

Add a chart to show the location of all of my resources
summarize count() by location | project  location, total=count_| order by total desc
| where total > 1

Now at my Azure Dashboard I have VMs per OS, all Public IP Addresses and the location of all of my resources

Find more at the Azure Resource Graph documentation

Pantelis Apostolidis is a Sr. Specialist, Azure at Microsoft and a former Microsoft Azure MVP. For the last 20 years, Pantelis has been involved to major cloud projects in Greece and abroad, helping companies to adopt and deploy cloud technologies, driving business value. He is entitled to a lot of Microsoft Expert Certifications, demonstrating his proven experience in delivering high quality solutions. He is an author, blogger and he is acting as a spokesperson for conferences, workshops and webinars. He is also an active member of several communities as a moderator in azureheads.gr and autoexec.gr. Follow him on Twitter @papostolidis.


Thanks Pentilis for sharing something new.